The Nuts and Bolts of Building Product Graphs

- Deepak Sharma | Sep 20.2018 | Senior Data Scientist
Product graphs can help Indian MSMEs become better at managing their stock items and derive insights for their business. Here are the nuts and bolts of building product graphs from Clustr’s viewpoint.
At the recent Anthill Inside 2018 conference held in July, I was intrigued by the discussion around ‘Building knowledgeable machines using Knowledge Graphs’. The talk by Prof. Partha Talukdar, who heads the lab at Indian Institute of Science, Bangalore, had a number of relevant insights that can be applicable in the real world.
‘Knowledge graph’ is a graphical data structure where the nodes are entities which have attributes and edges which are link between the entities. Usually various types of links exist between entities. For example, in a knowledge graph ‘Nestle’ node owns brand ‘Maggi’ node. Having a knowledge graph provides various applications. It helps in Natural Language Understanding (NLU), Mapping, Reasoning, Question Answering, Search etc.
Various types of knowledge graphs have been made popular. The more common applications are seen in Chatbots and Voice assistants which typically use a knowledge graph in the background. Few of the most popular knowledge graphs include Google Knowledge Vault, LinkedIn Knowledge Graph, Microsoft Concept Graph etc.
Building knowledge graphs:
Building a knowledge graph is essentially extracting entities, their attributes and values and analyzing linkages between entities. Typically, knowledge graphs can be built for a specific domain area using the corpus data. The research on building knowledge graphs have been deepened due to the efforts of tech leaders such as Google and Facebook. A lot of theoretical work on this has been done by Tom Mitchell’s lab NELL which showcases a continuous learning system (Never Ending Language Learning) to read the web.
At Clustr, we can use the same concepts to build a Product Knowledge Graph for our different tasks. We could build this using SKU titles and other product meta data available from different data sources.
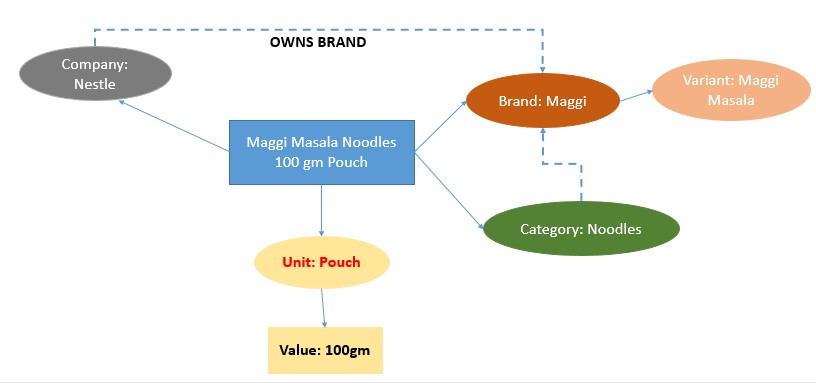
For example, in the figure above ‘Maggi’ is an entity in the product group, its attributes are that it is a brand, its company is Nestle and so on. It has a Product Category relationship to ‘Category: Noodles’ entity.
Extracting entities and relationships from data:
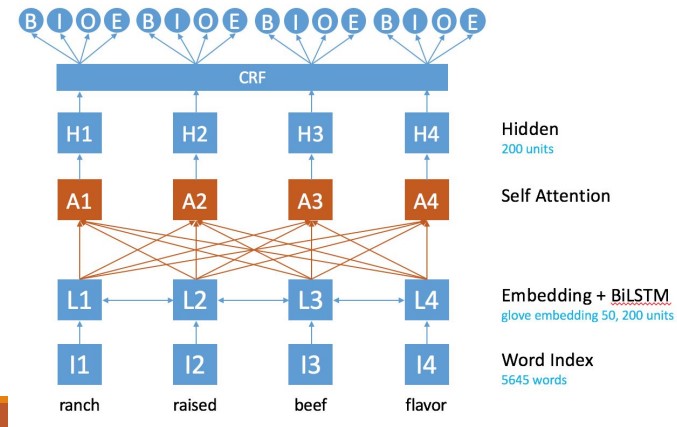
Extracting entities from data requires entity recognition models also called NER models. A simple NER model could be to extract all nouns from the SKU title. More complex entity recognition models can be build using tagged data. Typical techniques used to build these models include CRF, LSTM etc.
The above labeling provides a training model which can help us extract labels. How do we extract relationships? In traditional relationship extraction models, the structure of the language is used. However, in our case, building the model is not possible since we are working with product titles which rarely have language structure. An case in point is the product title we have seen earlier ‘Maggi Masala Noodle 100gm’. This title has very little structure. If we want to extract relationship between Maggi and Noodle, we do not have any other information except co-location.
This can be done in the following ways:
- Using the co-location for finding the relationships between entities. Implying that if entities of a certain type exist in the same product title then they have a specific relationship with each other. For example, if a brand and a category occur together in a product title, they have a relationship of the type ‘Is Product Category’. However, this generates a large number of False Positives. Hence, the relationships need to be trained on a small set of manually labelled data. Moreover, since labelling is a costly activity we use semi-supervised learning or boosting techniques where model iteratively learns and improves using to retrain the model using high confidence labels.
- Pruning the relationships by using probabilistic models where best graph structure is searched for. A MAP inference on all possible graphs to get the right graph. This is computationally challenging and can become intractable for large graph such as ours.
- Predicting the relationships through word embeddings. There are various methods for finding the legitimate relationships. We are exploring Translational Embeddings. The hypothesis here is that the association between entities boils down to translation of one entity towards the other. We are also looking at factorization models like RESNET to predict entity relationships. Here are some additional details on building knowledge graphs.
Validating the product graph:
The validation will happen through implicit and explicit methods:
- Implicit Validation method implies manually looking at the relationships generated in the graph. This needs to be done using machine and human validation and a power-packed UI. Not only does this make the task exciting and challenging, it can also go a long way in improving validation accuracy. We need to build the pipeline which will validate low confidence areas of the product graph and the labels will help algorithm further strengthen the knowledge graph. This type of pipeline has been used by NELL as well as google knowledge vault. Our expectation is that as we add more data and more manually labelled data the graph will be improved and will be better able to add entities and relationships for future data.
- Explicit Validation of the product graph will be done by validating the final task of resolution and search. The task of resolution is to map the raw product titles to individual attributes and an SKU in our product catalogue. An improvement in product graph should result in a commiserate improvement in resolution. Similarly, search is an explicit task which should improve by a better product graph. Here the metric is better search results. When an MSME customer searches for a product from our catalogue, we can determine how relevant are the search results. The relevance can be measured by the ranking of results selected by the user.
Benefits of using Product Graph:
Product graph will help us better understand raw text (curation) and user queries (search). We can then better extract entities because product graph will improve entity linking and co-reference resolution.
For example, “Apple 10kg” will be resolved as Apple fruit, not Apple brand because the product graph will be able to see that 10kg has a connection with Apple Fruit Category and not Apple Brand or Company.
Similarly search experience can be improved by using product graph to provide context to the search and making it more relevant. This way the search becomes more entity-based and contextual.
The product graph can also be used for auto completion. A variety of learning from graph algorithms can be used for inference. Bayesian network based models are some of the more popular ones for inference on graphs. This is a complex problem with lot of research happening on this. We can explore these concepts in more detail in future articles.
At Clustr, we could use the product graph primarily to improve resolution and mapping services. This will also help in improving aggregation as well as search and select service. Resolution services will help convert the raw product titles of the customer to structured entities from our catalogue. Having structured entities will help customers avail various GET and AGGREGATE services. For example, the above Maggi Masala Noodle 100gm SKU will get mapped to its attributes and item in our catalogue. Clustr can then help customers with updates in tax rates, information on Nestle, average Noodle price in the area, popular variants of the SKU, number of this SKU selling in the region, forecast of the SKU and how much should customer stock etc.
Similarly, the product graph can help improve search services, allowing customers to run their day to day operations more efficiently.
Conclusion:
So far, the MSME sector in India has not been able to take advantage of the advances in Big Data Analytics. At Clustr, we aim to do this in a scalable and highly cost-effective manner for it to be consumable by the FMCG sector. For this, our approach is to first map their stock items to our catalogue. Then, with our technical expertise and deeper understanding of their buying and selling behavior, provide the MSMEs with highly tailored recommendations.
Product graphs stand to help MSMEs become better at managing their stock items and derive insights for their business. They can improve mapping of customer items to Clustr entities. And improved mapping will help us improve our recommendations and aggregations and will help us reach more customers.
share


Leave a Reply